In the past two decades, DNA sequencing has become a massive and central source of biological data. Human data in particular has exploded in quantity. Before the millenium, we could read little bits of our own source code, painstakingly; as of 2025, we can survey hundreds of thousands of whole human genomes and tens of millions of human genotype thumbnails (SNP arrays).
This article will give the broad outlines of this story in data. How much data do we have today? How diverse is the data? Who’s collecting it? What are we learning from it?
In 1953, Watson and Crick uncovered the structure of DNA. The natural next thing to do was to start reading the sequences of nucleotides that make up DNA. For the rest of the 20th century, though, DNA sequencing was laborious and expensive. Studies in the 80s and 90s focused on small portions of DNA such as single genes or gene complexes. In 1995, Craig Venter’s team sequenced the genome of the Haemophilus influenzae bacterium, at 1.8 million base pairs, making it the first (non-virus) organism to be fully sequenced.
The 21st century (which of course started in the 1990s with the eruption of the Internet) saw DNA sequencing go full scale. In 2000, after a decade of work, the Human Genome Project announced the completion of the first draft sequence of a complete human genome. That genome comprises roughly 3 billion pase pairs, assembled by putting together in order many short reads of DNA taken from several different people. All told, including related research, the project cost $2.7 billion; to sequence another single whole human genome with the same method would have cost hundreds of millions of dollars and taken about a year.
A decade and a bit later, in 2012, the 1000 Genomes Project announced that they’d sequenced 1092 whole genomes, likely at a cost of around $120 million. One more decade later, in 2023, the UK Biobank announced that they’d sequenced the whole genomes of their nearly 500,000 participants, likely at a cost of around $200 million. Roughly speaking, DNA sequencing got 1000x less costly in 10 years, twice in a row.
Here’s the NIH’s estimates of the cost of sequencing a whole human genome, over time:
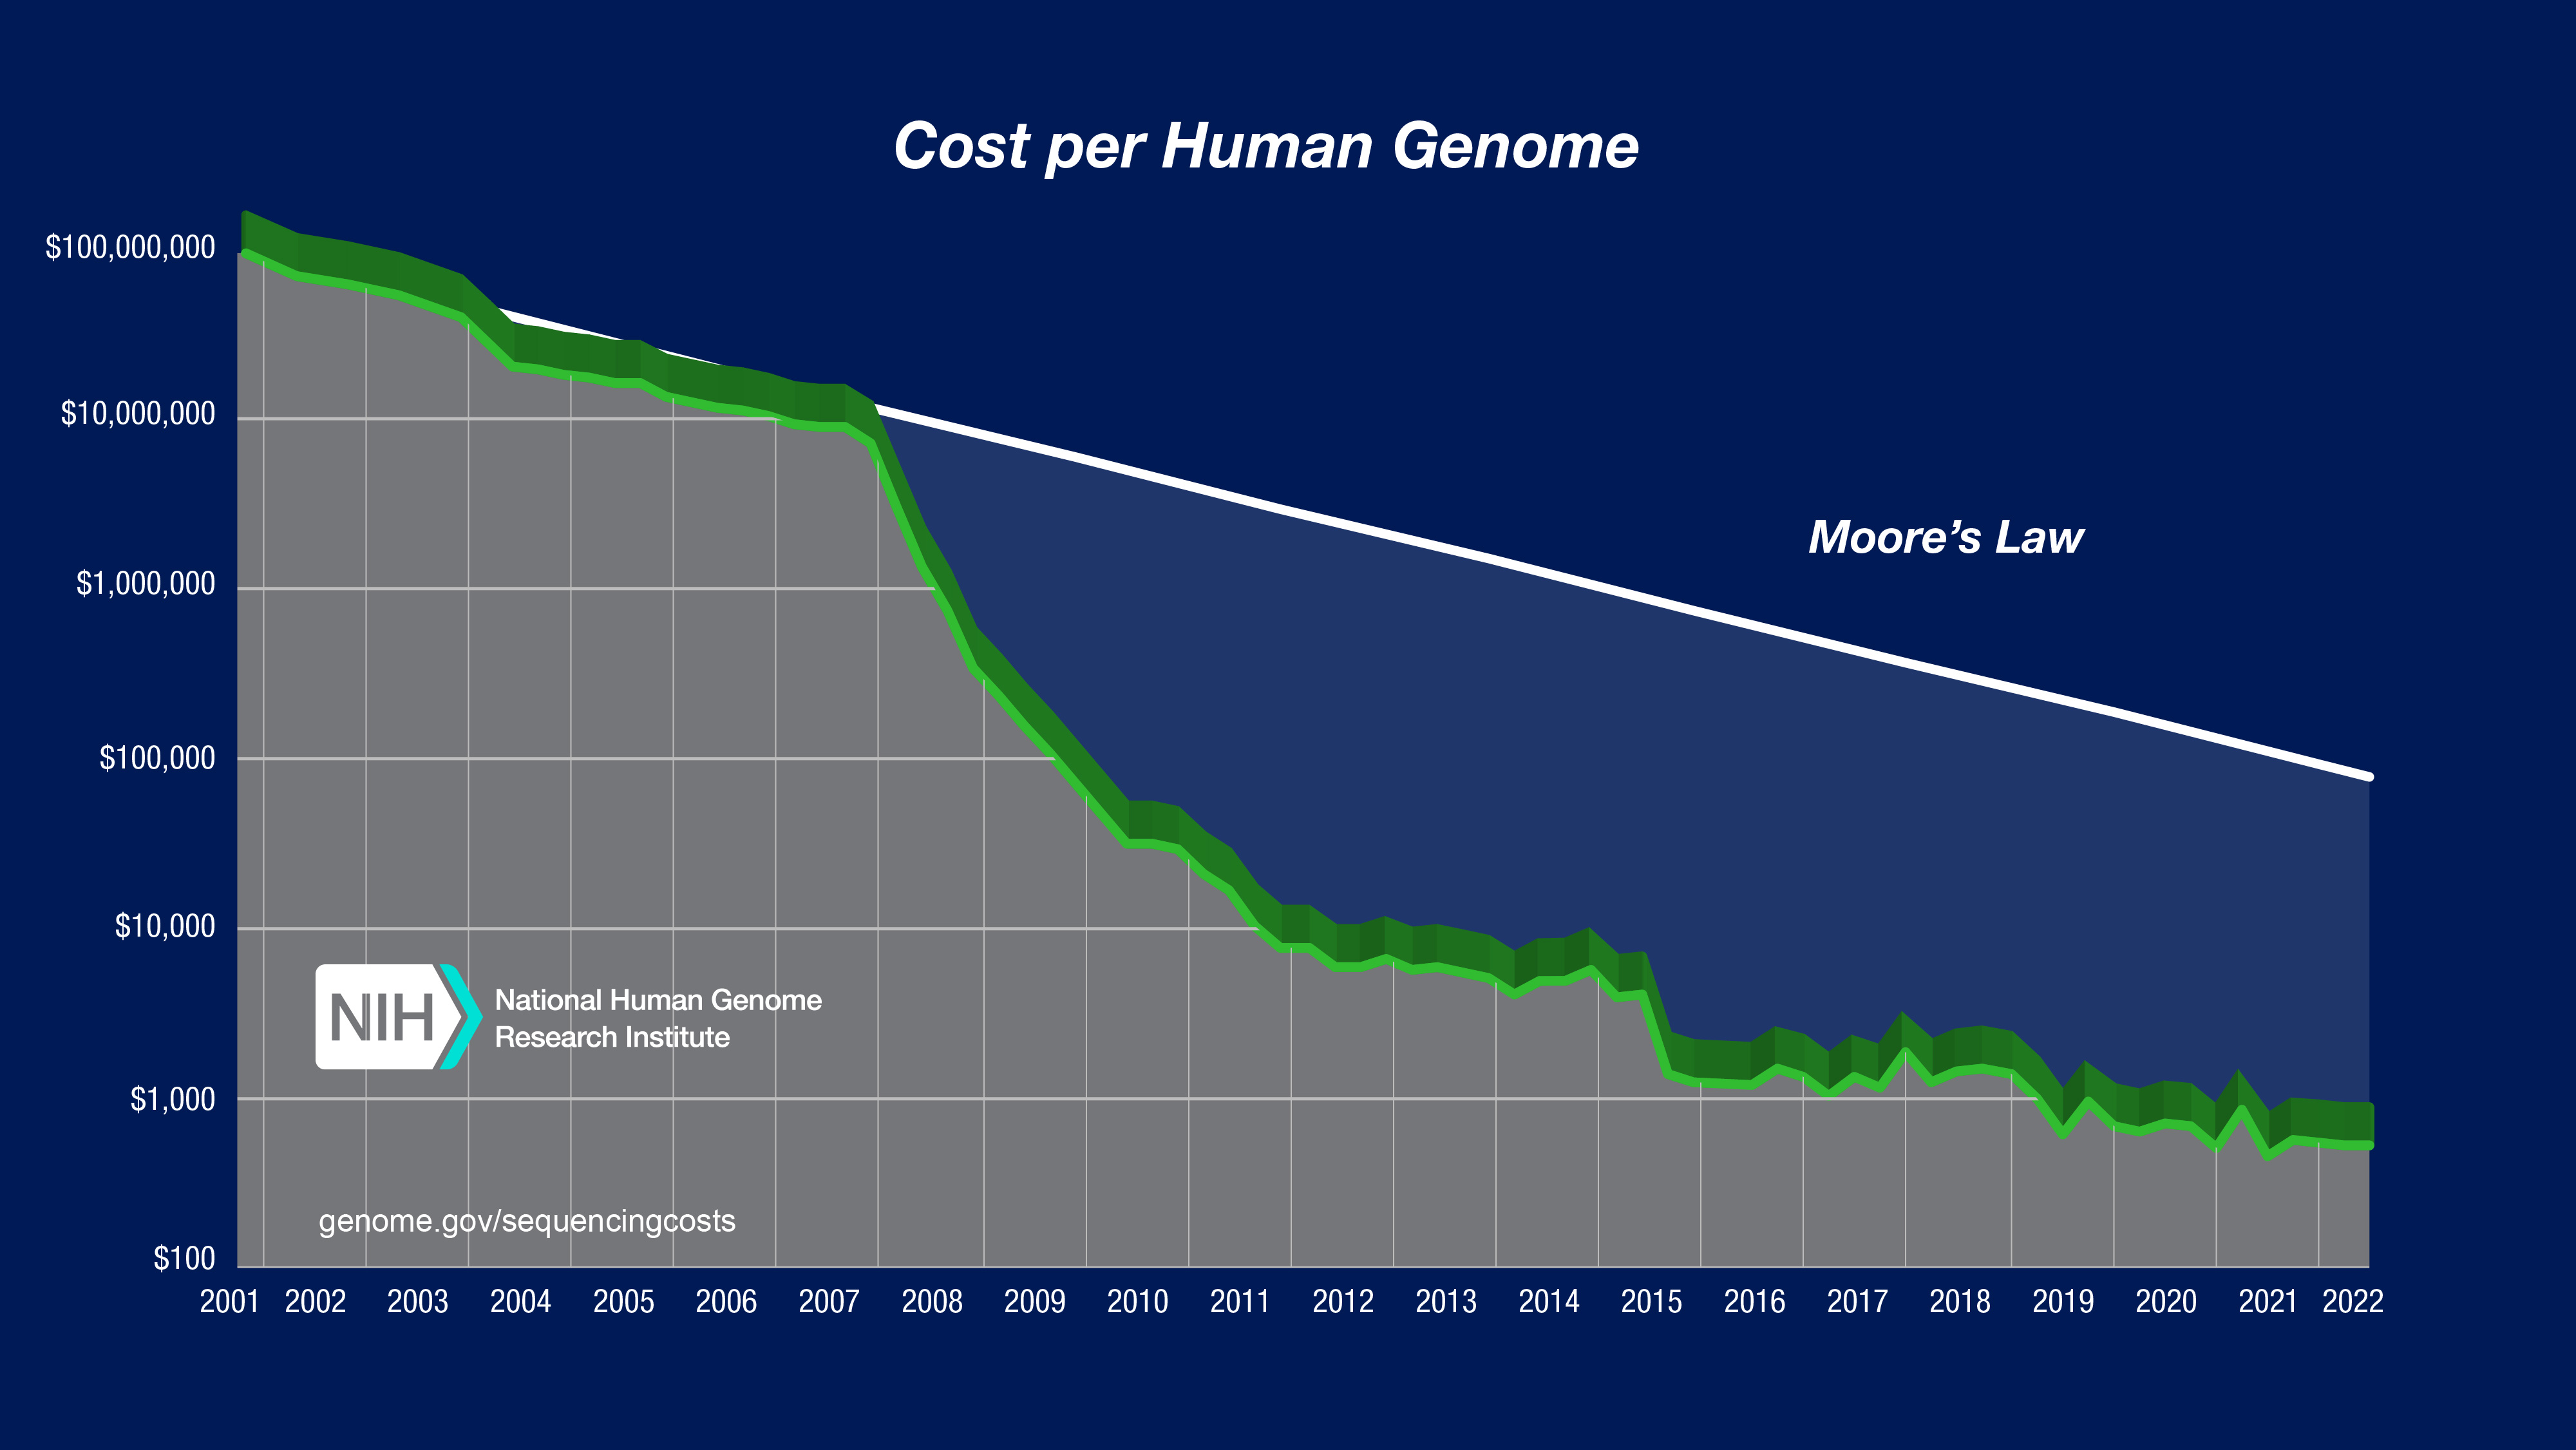
Wow. For a final price point: as of the start of 2025, several companies such as Nebula Genomics seem to offer 30x depth whole genome sequencing to individuals for under $500.
Concomitant with the drop in cost for DNA sequencing, there is a wave of data being actually collected. What kind of data?
In the broadest sense, genetic analysis means getting any sort of information about the DNA sequence in an organism. So this would include e.g. karyotyping, which looks at the gross morphology of chromosomes—how many chromosomes are there in this cell, and how big are they.
More narrowly, if we want to understand genes and correlate phenotypes with genotypes, we want a bunch of information about specific sequences of nucleotides in an organism’s genome. There are two main ways to learn what specific sequences of nucleotides are in a sample of DNA:
In short, genome-wide SNP-array genotyping is like looking at a thumbnail-sized version of a big image: it’s a pretty good overall representation, and smaller and cheaper, but drops a bunch of detail. Whole-genome sequencing is like getting the whole image, but with some noise and uncertainty added in, so some pixels are wrong. (You get less noise if you use a higher read depth, i.e. you sequence more copies of each DNA region.)



From left to right: full image (the actual whole genome); full image with noise (the whole genome inferred by sequencing); small version of the image (SNP-array genotyping).
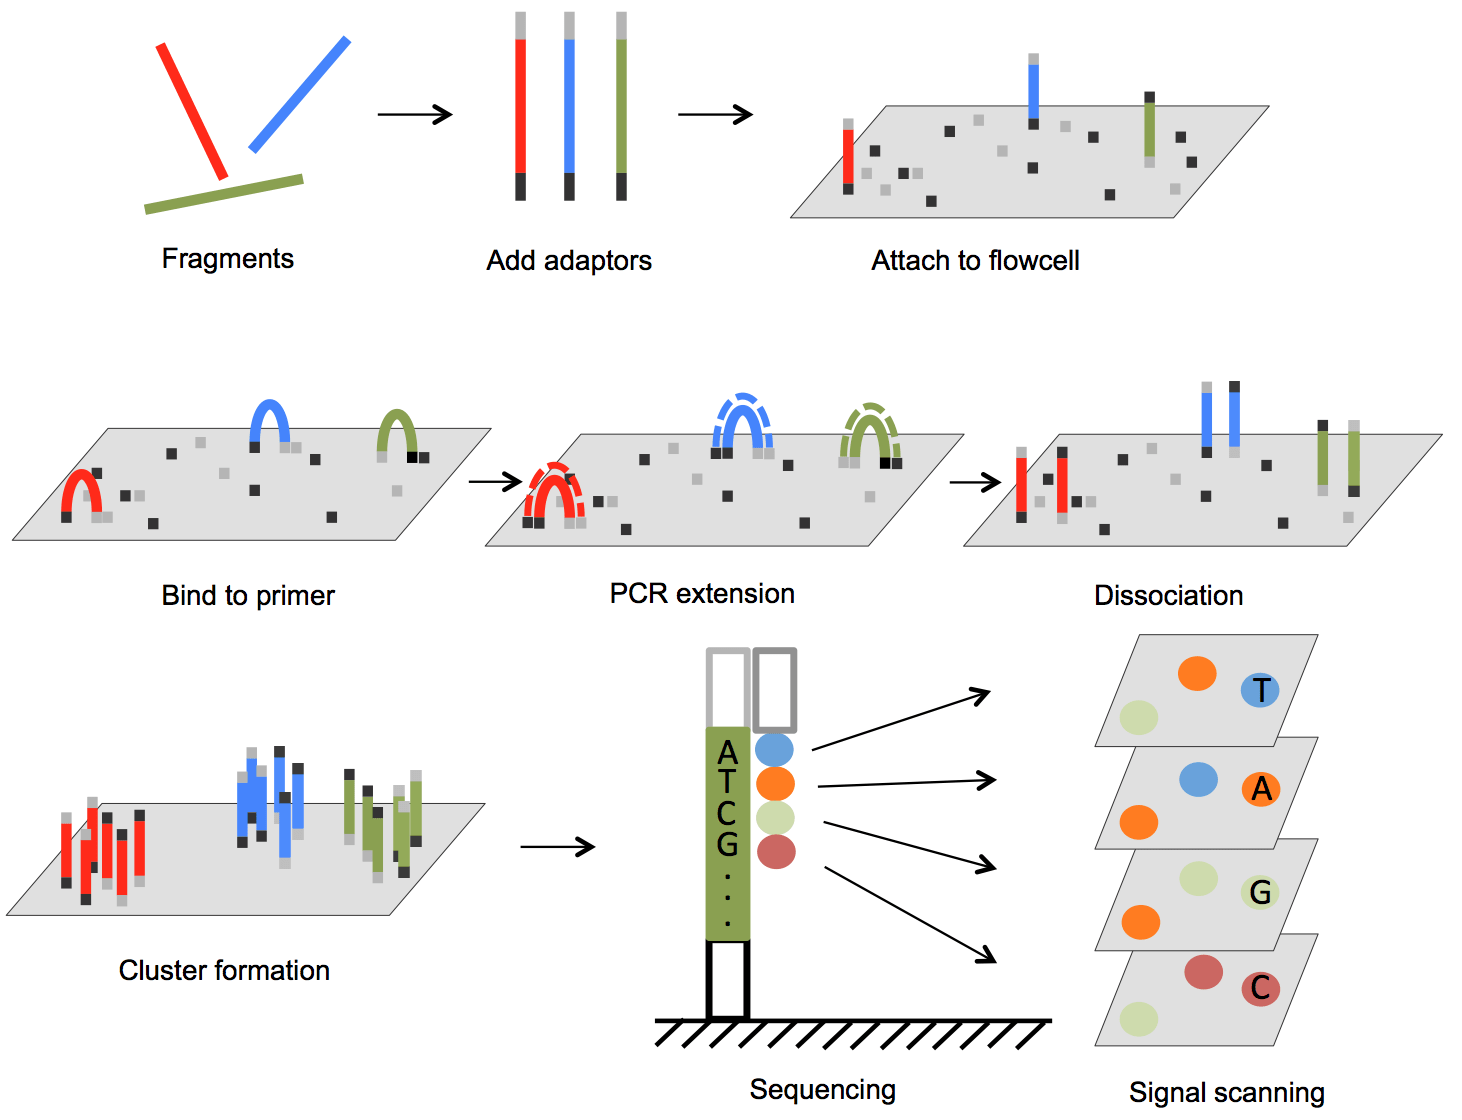
To sequence a whole human genome, we do DNA sequencing. In the current dominant method, called next-generation sequencing, we break up the DNA into short strands, read all the strands in parallel, and then assemble the genome computationally by approximately aligning the fragments with a reference whole human genome. Diagram:
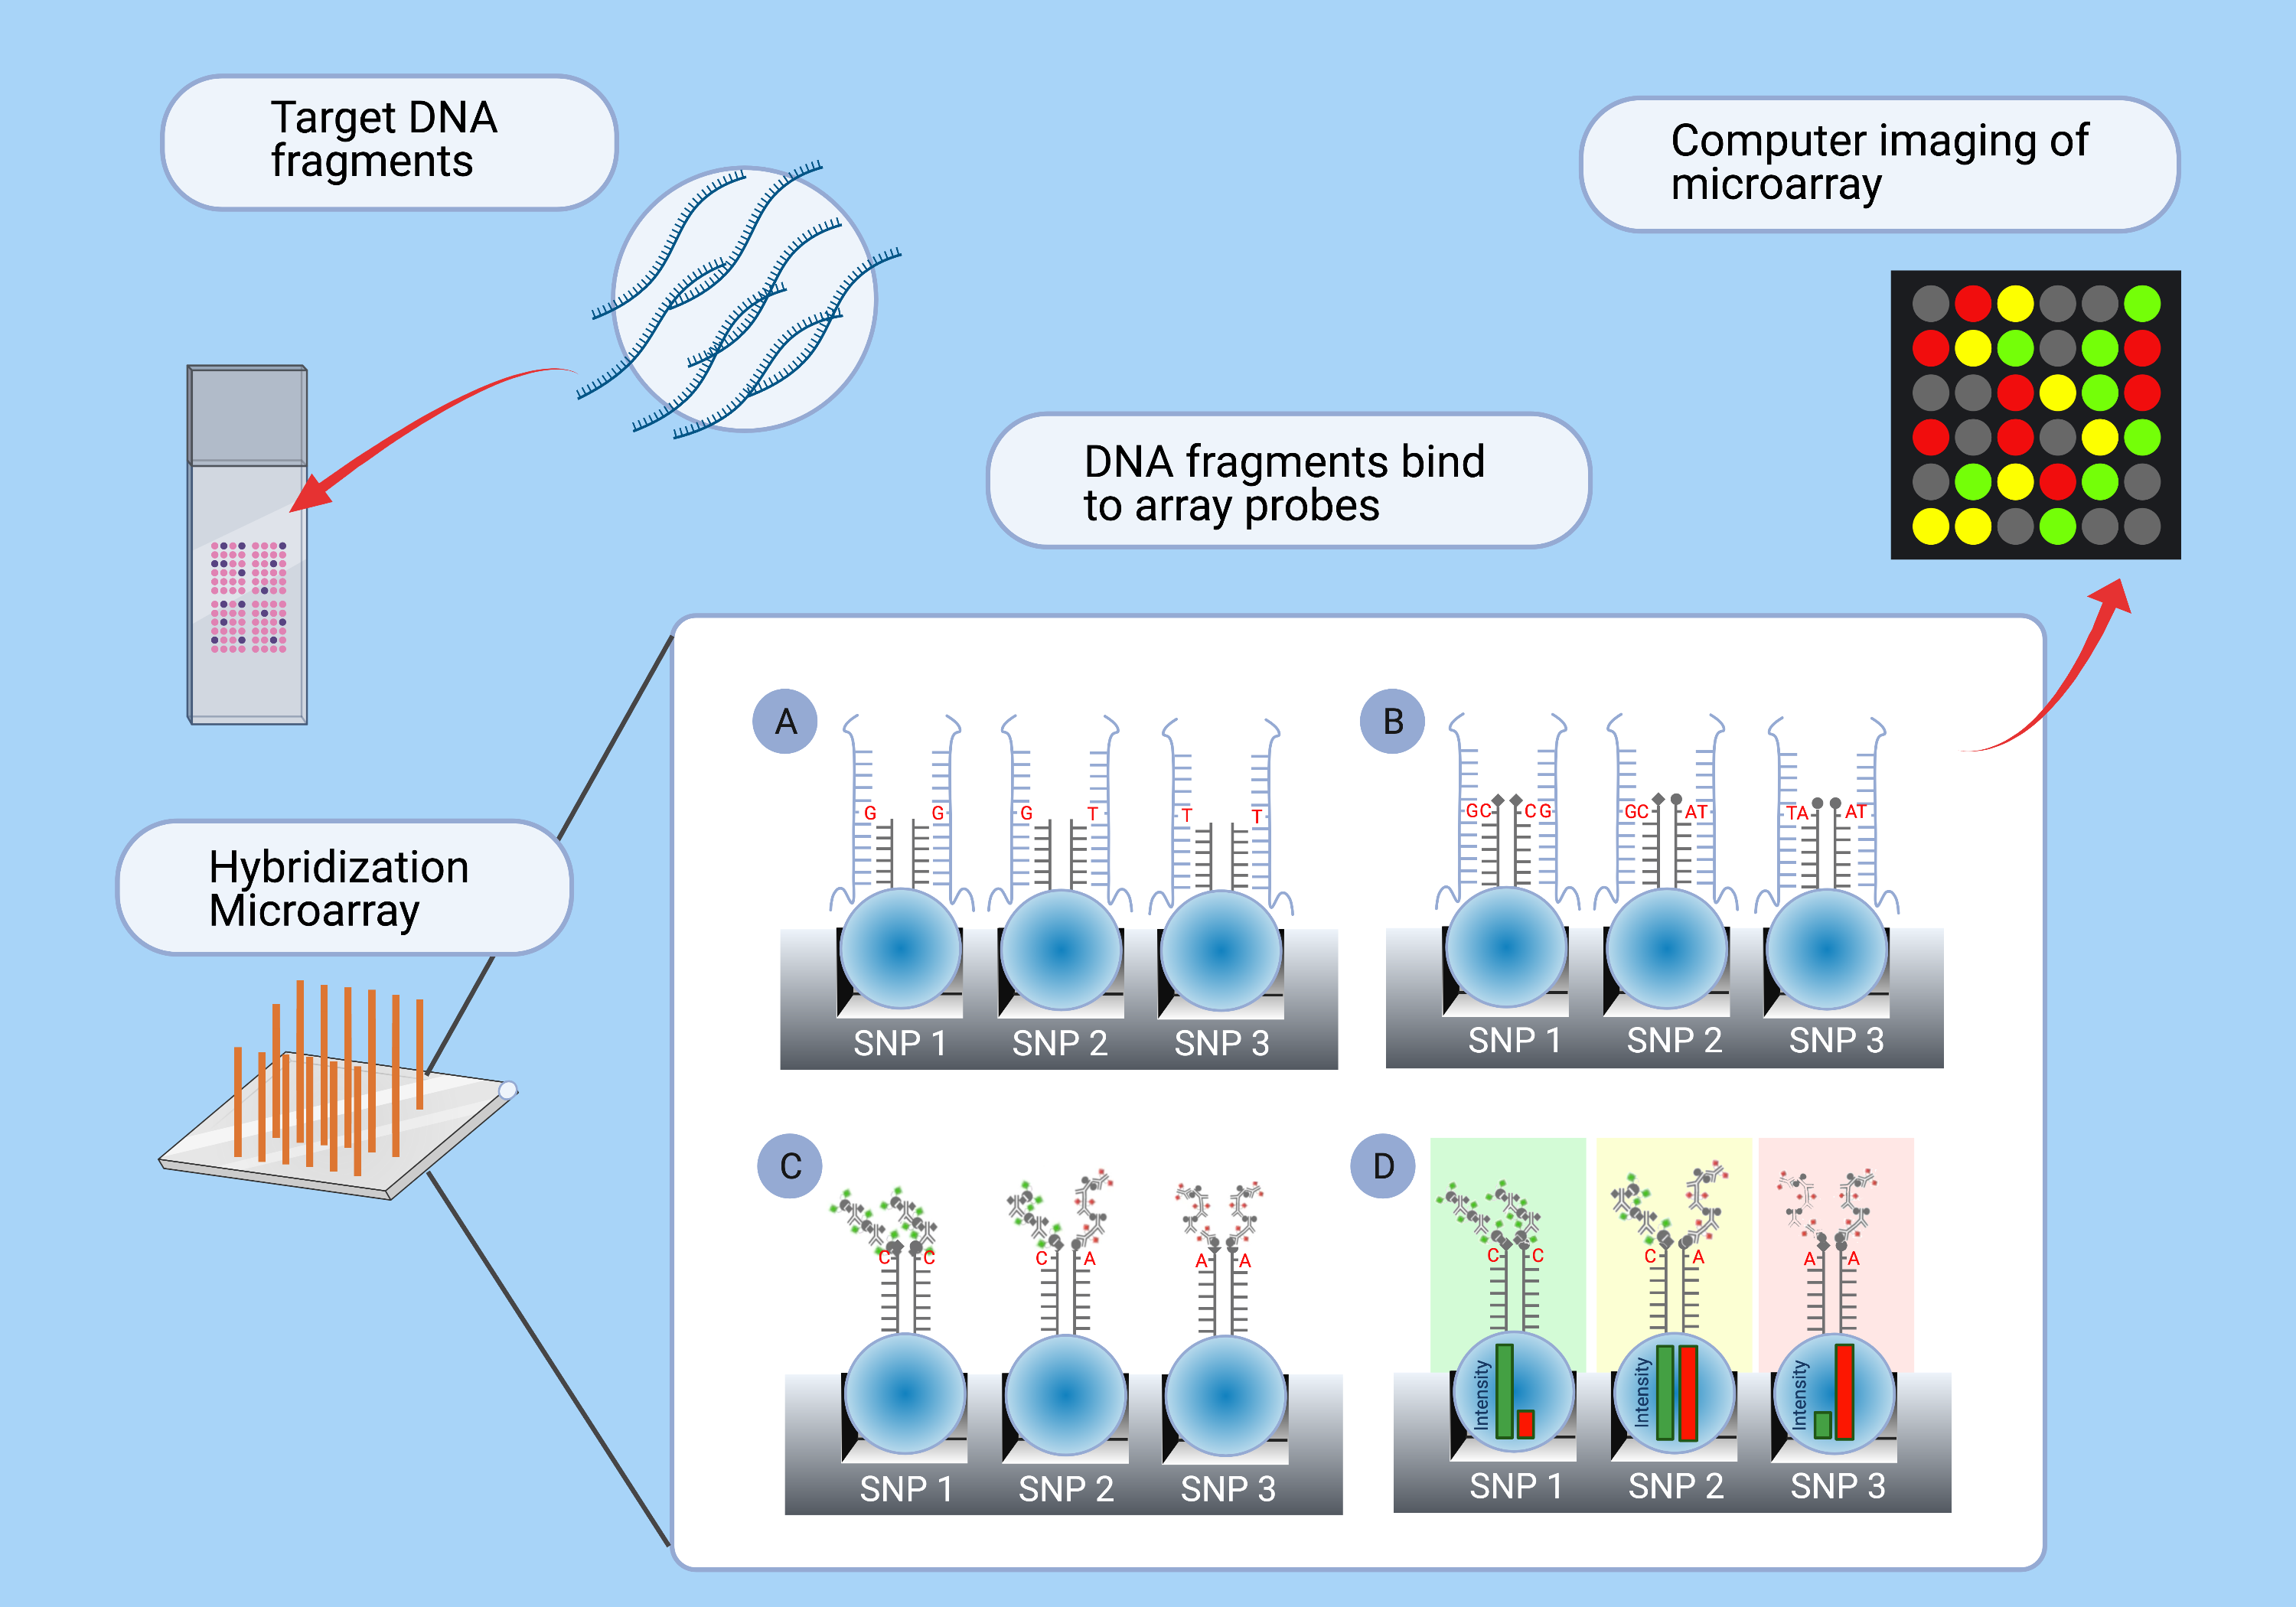
To do SNP-array genotyping, a widespread type of DNA genotyping, we first produce a library of target fragments—short DNA strands that we want to detect from our new DNA sample. The fragments are attached to an array, and then we add DNA fragments from the new sample. If the sample contains a sub-sequence that matches one of our target sequences, they bind together, which somehow makes them light up (e.g. because a fluorescent nucleotide binds to the new sample fragment). Diagram:
In the late 20th century and early 21st century, SNP genotyping was expensive, so researchers would create small arrays with, say, thousands of SNPs. But the cost of SNP-array genotyping has plummeted, and for the last 15 years or so, it’s common to do genome-wide genotyping, which checks typically .5 to 1 million SNPs across the whole human genome.
Sequencing a whole genome gives richer data than genome-wide genotyping. There are at least 10 million SNPs in humans with minor allele frequency at least 1%; and there are likely hundreds of millions of rarer SNVs (single nucleotide variants). While a SNP array typically measures up to 1 million SNPs, two unrelated human genomes will have in the ballpark of 5 million base pairs of difference between them. So whole genome sequencing (often abbreviated WGS) will tell you about 5 times as many uncommon variants, compared to what SNP arrays directly tell you.
(However, SNVs that are nearby on a chromosome usually ride along together during reproduction, unless there happens to be a chromosome crossover right in between them during meiosis. So nearby SNVs are correlated with each other throughout the population of humans. A common SNP is correlated with other nearby SNPs/SNVs, so via imputation (https://pmc.ncbi.nlm.nih.gov/articles/PMC2925172/), a SNP-array genotype also tells us something about those other SNVs. This is analogous to applying an upsampling method to a low-resolution image, adding detail based on priors gained from looking at other images.)
On the other hand, WGS is slower and more expensive than SNP array genotyping, and genotyping often provides most of the information you wanted anyway. A common design study has two stages: First you whole genome sequence a small set of participants, and in their genomes you look for SNVs that seem like they might be relevant to your study (e.g. the variant is in a gene that codes for a protein that someone said is related to the disease you’re studying). Then, for a much larger set of participants, you get SNP-array data that checks for the maybe-relevant SNPs you picked. In this way, we can focus on the most relevant bits of the genome to be measured at larger scale. Also, standard common SNP data might already give you a lot of what you wanted, for the purposes of finding correlations between, say, a disease and some genetic variants. The most common variants will be the ones that are easiest to notice as being correlated with the disease. Also, for a SNP, both the common and uncommon variants are reasonably likely to show up in some new genome, so measuring a SNP gives more information about the new genome compared to measuring a rarer SNV. Thus, in general, by zooming in on the most relevant subset of DNA, SNP-array genotyping has given a good bang for your buck, for getting information about a human’s genome.
Since whole-genome sequencing has gotten so inexpensive and is getting even less expensive, it may take over as the default method of genetic analysis. The total cost of WGS and SNP-array genotyping may converge to the fixed per-sample costs of collecting, shipping, and managing samples, apart from the sequencing process itself. Besides, for purposes of discovering rare high-impact variants, WGS is best.
How many whole human genomes have been sequenced, since the first in 2000?
Up to the end of 2024, the project that has sequenced the most whole human genomes is the UK BioBank, at 491,554 announced so far. A biobank is a collection of biological samples paired with information about the source. If it’s a sample from a person, the extra information can include various phenotypes such as health, life history, and cognitive traits. The sort of data in the UK BioBank, full genomes paired with phenotypes, is the most useful sort of data for learning how genes affect health and cognition. There are several other large national biobanks, such as the Million Veteran Program in the US, BioBank Japan, and Qatar Biobank.
There are many research projects that sequence smaller numbers of human genomes. Unfortunately, as far as I know, there’s no organized index of projects that have sequenced whole human genomes specifically. There are various online databases and indexes, e.g. provided by NCBI, but much of the relevant data wouldn’t show up there (e.g., many whole genomes are announced to have been sequenced, but are kept private). (In 2018, molecular geneticist Professor John Archibald wrote: “As strange as it sounds, it is no longer possible to determine how many human genomes have been sequenced.”.)
To get some sense of how much WGS data has been collected, I spent some time searching for announcements of WGS data collection. This is definitely not a comprehensive list, it’s just a convenience sample of what I found with search engines and following citations. It probably doesn’t leave out many very large (say, >100k) datasets of whole human genome sequences, but should only be taken as a mostly-conservative lower bound on how many whole human genomes have been sequenced. (The data, and more detail on methods, are given in the Appendix. Thanks to Tassilo Neubauer for assisting me with data collection.) Here’s the graph showing absolute numbers:
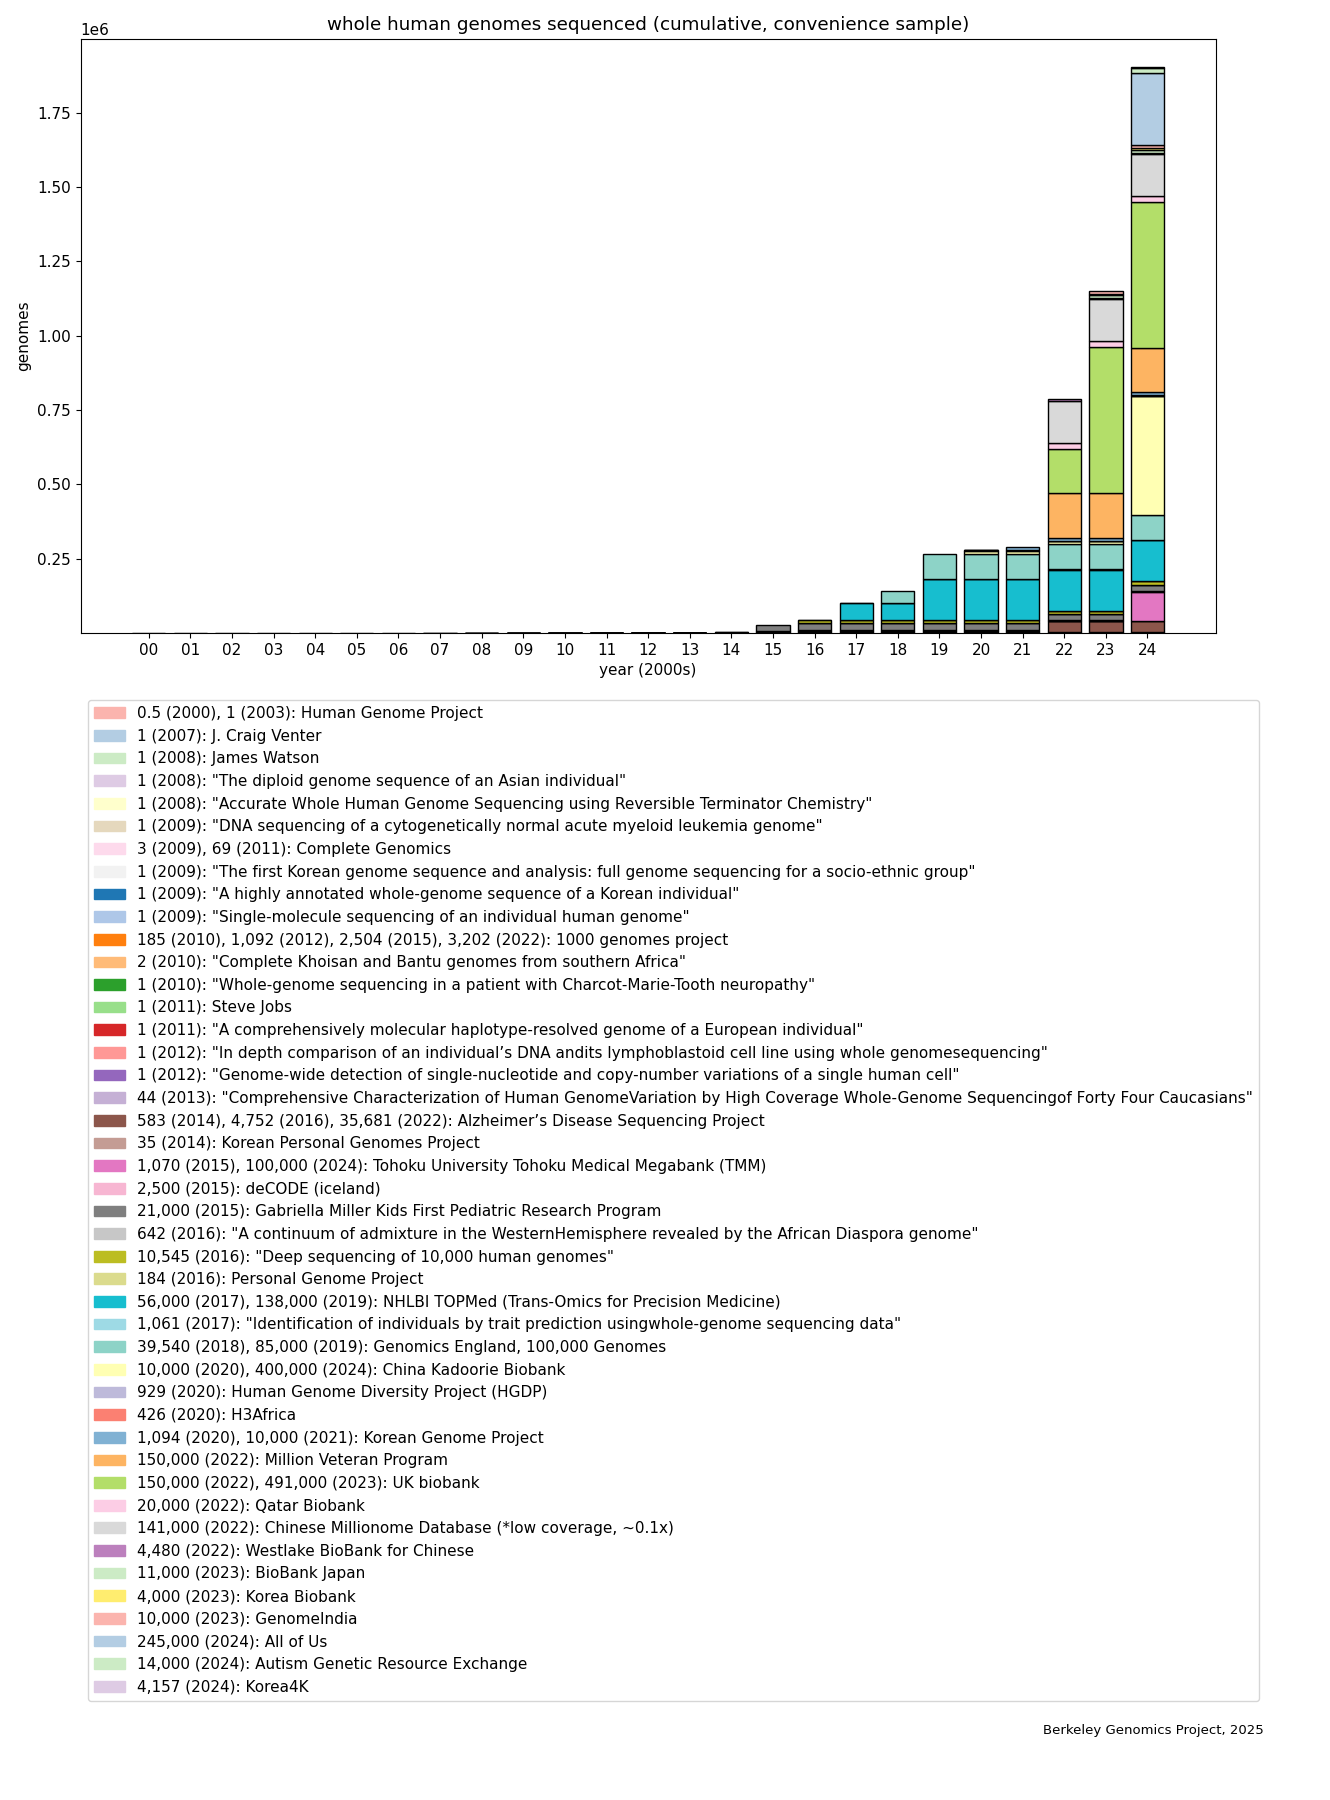
The rapid rise is evident, and most of it happened in just the past 5 years, coming from large biobanks—the UK biobank, All of Us (NIH), and the China Kadoorie Biobank, each with hundreds of thousands of whole genomes, and several other projects at around the 100k level. (But these are also the easiest to find; there are likely many smaller projects, e.g. academic research involving hundreds or thousands of human WGSes.) Putting the same data on a logscale (bars are linearly scaled to fit the log of the total in each year):
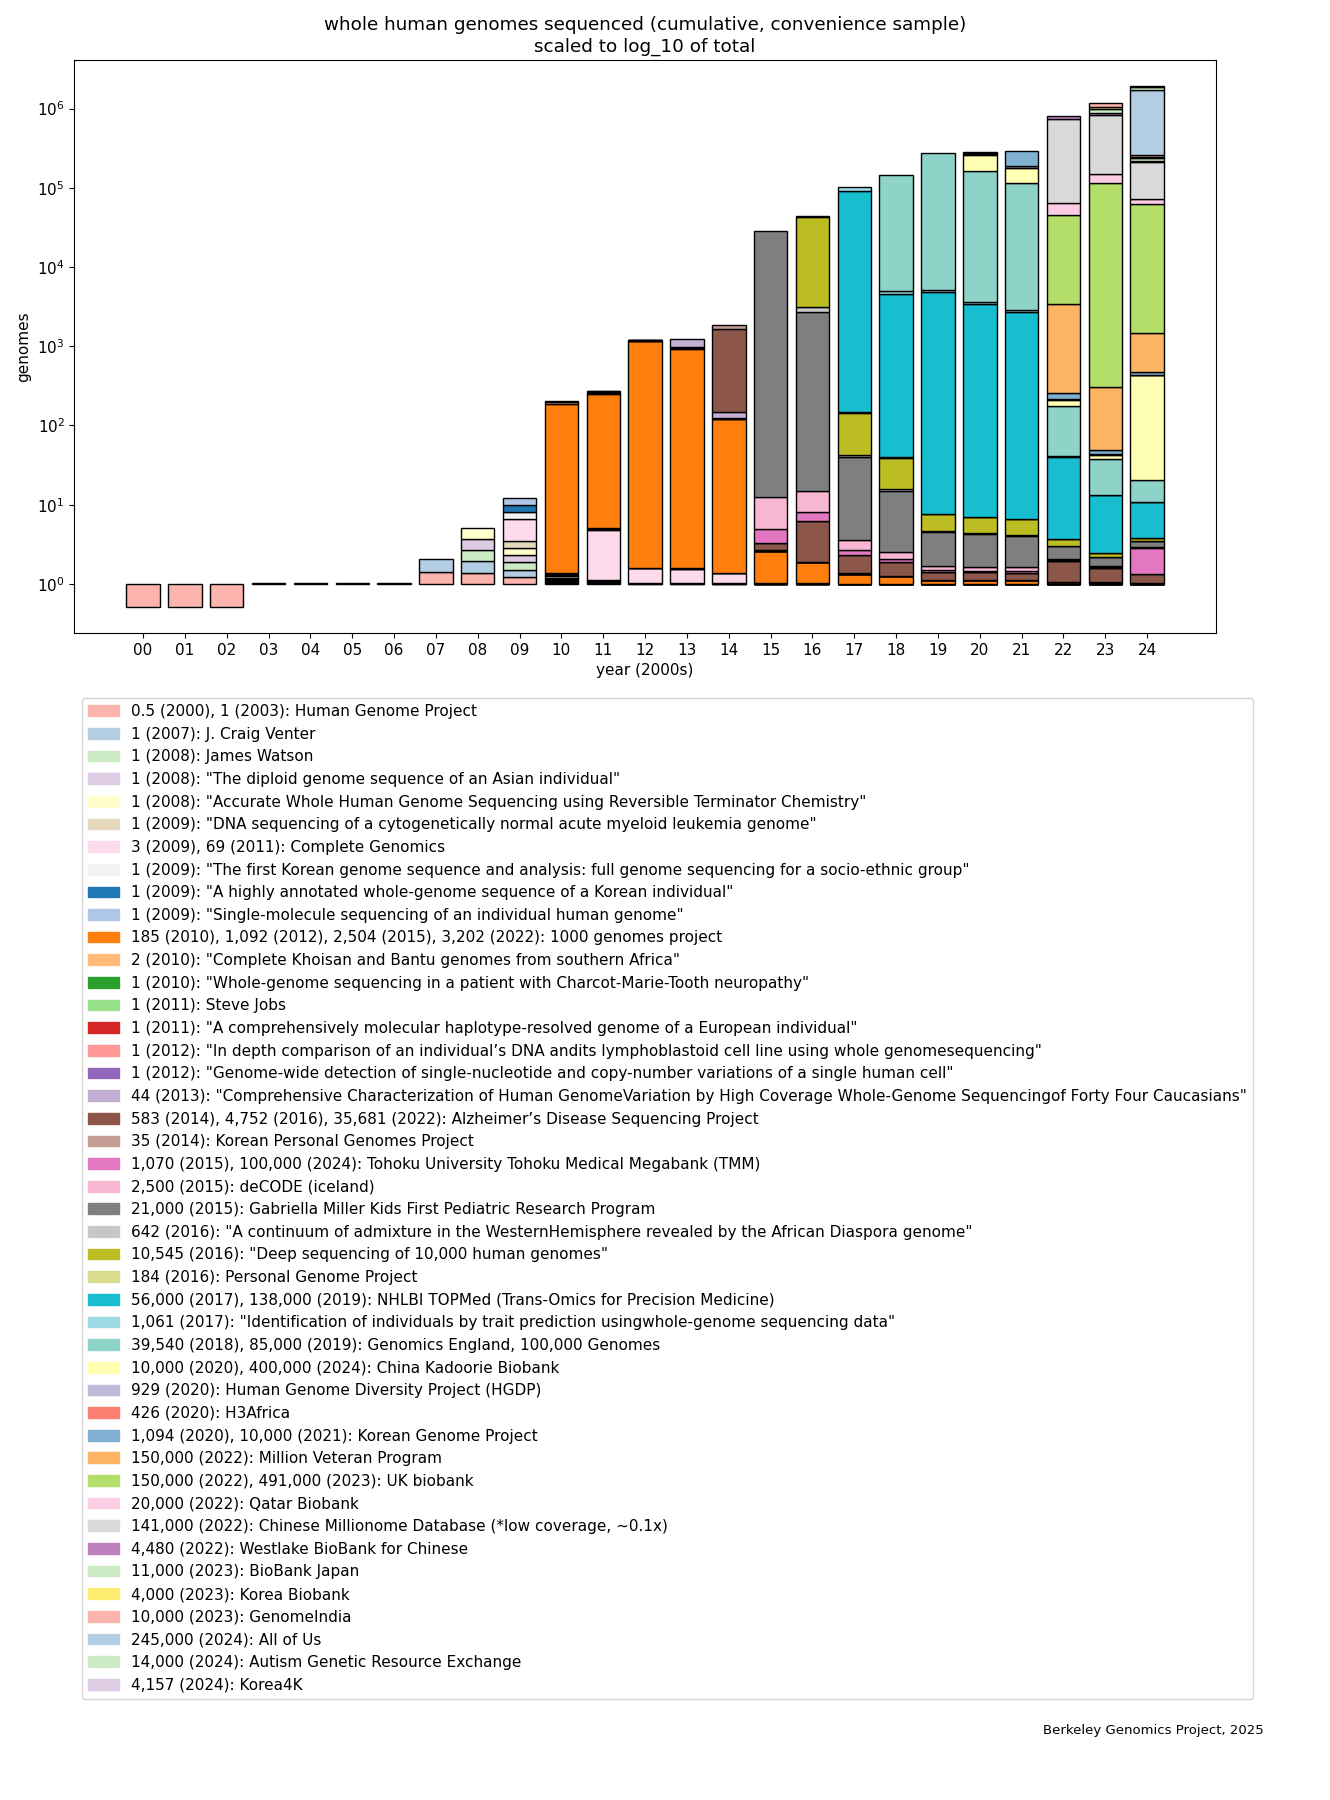
We see that in the past two decades, coarsely speaking and according to this convenience sample, the rise is linear on the logscale, i.e. roughly exponential. The spike in 2010 is due to the 1000 Genomes Project, which was an international collaboration that leveraged the new next-generation sequencing technology to collect a WGS dataset that was not only the largest at the time, but also was sampled from people with a diverse range of ancestries. (Among other benefits, data from diverse ancestries is valuable because it helps us to identify genetic variants that are causally, not just correlationally, related to phenotypes of interest.) Note that most of this data is private or has its access restricted to some set of researchers.
In parallel with the cost drop in whole genome sequencing, the cost of SNP genotyping has plummeted. Around the turn of the millenium, genotyping one SNP cost around half a dollar; today, a genome-wide SNP array might genotype SNPs for a hundredth of a cent—a 5,000x decrease (https://www.nature.com/articles/nrg1521). The advent of WGS data allowed us to find common sites in the human genome where humans tend to differ from each other—i.e., what SNPs you’d want to check in a human’s DNA, to get a lossily compressed summary of their “DNA fingerprint”. Together, these changes unlocked the genome-wide SNP array.
How many humans have been genotyped with a genome-wide SNP array?
As impossible as it is to get an accurate count of whole human genomes sequenced, it’s doubly impossible to get a count for genome-wide SNP arrays.
As one touchpoint, the incumbent leading sequencing company Illumina states here (https://www.illumina.com/products/by-type/microarray-kits/infinium-asian-screening.html) that “> 20M samples of Illumina Infinium arrays have been ordered by a global community of users.”. That is only one company; there are several other major DNA analysis companies.
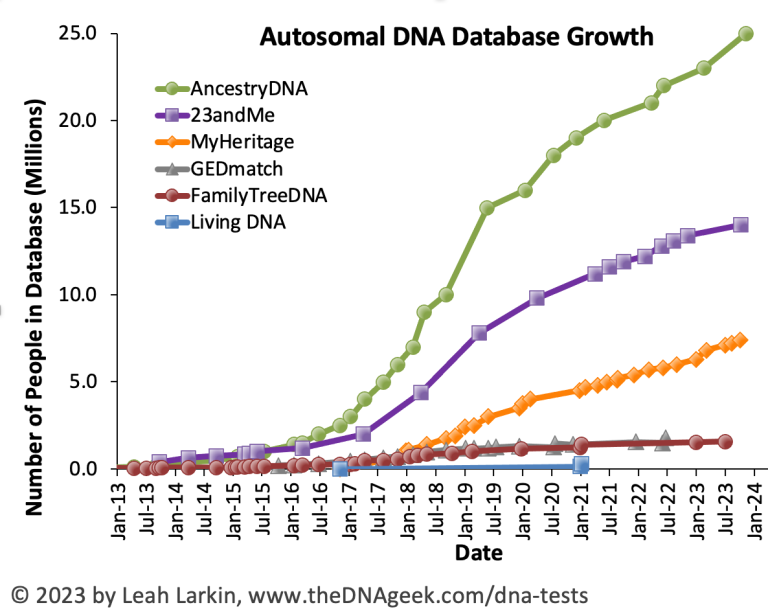
There are many genome-wide SNP array datasets, from small academic studies to national biobanks. Some are quite large—for example, Finland’s national FinnGen, the United States’s Million Veterans Program, and Estonia’s national biobank, each with hundreds of thousands of genotypes. Biobanks tend to pair genotypes with phenotypes, making them invaluable for genome-wide association studies. But if we’re strictly looking at genotyping data, the largest datasets are all held by commercial genotyping companies such as 23andMe, which offers ancestry and health information inferred from genotypes. Leah Larkin produced this graph (https://thednageek.com/dna-tests/) of data collected by the major commercial genealogical companies:
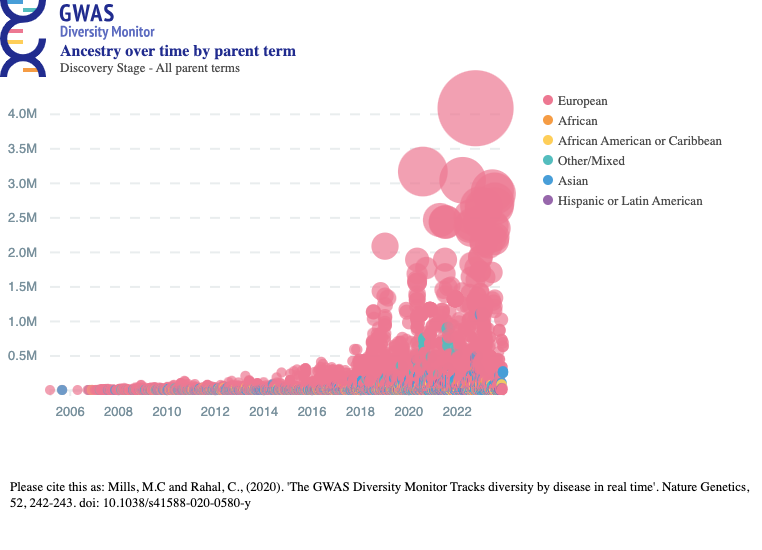
As an indirect way to get a sense for how much genotype-phenotype data there is, we can look at the GWAS Diversity Monitor (https://gwasdiversitymonitor.com/), which is based on the NHGRI-EBI GWAS catalog (https://www.ebi.ac.uk/gwas/). (The Diversity Monitor gives some summary statistics here: https://gwasdiversitymonitor.com/additional-information.) Each bubble is a study, its size and height shows the number of participants in the study, and the color indicates the ancestry group of the participants in the study. Here’s the graph for all studies:
And here’s the graph for studies just in the ancestry groups African, African American or Afro-Caribbean, and Hispanic or Latin American:

Note that large GWASes use multiple preexisting datasets, rather than always creating their own new huge dataset. So there’s a large amount of overlap between these bubbles—the studies they represent reuse the same data several times. Even so, it’s clear that GWASes have kicked into a new gear in the past decade, fueled by genotyping data.
This article looks at human WGS data, and touches on genome-wide SNP data. What other DNA has been sequenced?
Basically, this is a convenience sample. I spent something like 20 or 30 hours, with assistance from Tassilo Neubauer. For discovery only, I used Google, Google Scholar, Exa Search, and chatGPT. Then I checked the original sources (papers, news reports, website announcements) to quasi-verify the dates and amount of WGS data. I reached a point where I wasn’t finding more very large datasets, but I didn’t reach a point where I wasn’t finding more small datasets. The following appendix gives more info, mainly as starting tips in case someone wants to do a more thorough data collection.
The data used is in this spreadsheet: https://docs.google.com/spreadsheets/d/11sgeHe-gU5hr-ghSLSQaKozKyWNXs4yX-dfdn-nKCmw/edit?gid=0#gid=0. (It may be very slightly out of date from the version used to make the graphs.) Feel free to copy and extend if you like (with attribution to the Berkeley Genomics Project and this article, please, if you’re substantially using the data or code). The code for generating the images is here (it is bad code, but shared for completeness / good spirit in case it is helpful): https://gist.github.com/tsvibt/53b1497dcd320e3a8403329d5c763ac9
One could potentially collect more comprehensive estimates by tracking NGS machines, or by contacting sequencing companies. One could also ask IVF clinics who provide PGT-P for data on how many whole genomes they’ve sequenced.
I only included data where I was reasonably confident of the numbers, e.g. if they were described clearly in a paper. Several biobanks, e.g. Biobank Sweden and Biobank Graz, were excluded because I didn’t quickly find information about how much WGS data they had collected. I excluded prospective statements, e.g. that some group “expected to” have sequenced some people by some future date.
At first I was also recording large datasets of SNP-array genotypes. But it became clear that there’s a vast set of studies that genotyped many participants, and it would take an enormous effort to catalog them. Part of the difficulty is that it would take work to avoid overlap, discussed below. Also, SNP-array genotypes collected in academic studies are dwarfed by the data collected by DNA ancestry companies.
I also excluded whole exome sequencing and whole chromosome sequencing data.
I arbitrarily (and maybe not fully consistently) excluded tumor whole genome sequences (or counted an individual + their tumor as one WGS). A tumor isn’t a person, but on the other hand its genome is almost identical to that of its host.
I didn’t perfectly carefully account for overlap between projects. In other words, I didn’t verify that every datapoint refers to different WGS data. But there should be very little overlap in the data used to make the WGS graphs; most of the datapoints have sources stating that some organization did the sequencing, distinct from other organizations. The worst source of double counting would be counting information from sequencing companies. For example, I was going to include data from “In depth comparison of an individual’s DNA and its lymphoblastoid cell line using whole genome sequencing”, but then I noticed it stated it used Complete Genomics, and I’d already included some data from Complete Genomics summarizing how much WGS they’d done. (But, Complete Genomics is the only WGS company report that I included.)
I counted the Human Genome Project as one whole genome. However, it’s exceptional in at least two major ways. First, whereas most WGS data is assembled by aligning reads to a reference genome, the very first genome was of necessity assembled de novo, by figuring out which reads overlap in what order from scratch. Second, technically it wasn’t the genome of a single person; the first reference genome was assembled from reads taken from several human DNA samples. Still, it is at least as much data as any other WGS.
For the most part, I don’t account for coverage / read depth, which can be as low as <5x or as high as >100x. Most projects tend to have coverage roughly in the range 25-35x. This does affect how much raw DNA has been sequenced, in a sense, but there are diminishing returns to higher coverage in terms of information gain about human genomes.
I allowed for mostly-complete WGS data. The Human Genome Project sequenced about 92% of the genome (see https://www.nih.gov/news-events/nih-research-matters/first-complete-sequence-human-genome). In fact, nearly all WGS data is only mostly-complete: as recently as 2022, the paper “The complete sequence of a human genome” announced they’d sequenced the full whole human genome for the first time.
I also allowed for ambiguity in the genome assembled from short-read sequencing data. There are several kinds of ambiguity, both of which are present in almost all WGS data today. One kind is that the number of copies of long repetitive DNA motifs can’t be precisely resolved just from short-read data. Another kind is that even if we see that a genome had two alleles of a SNP, we can’t necessarily determine which of the two homologous chromosomes had which allele—we just get one haploid genome, and then a bunch of SNPs (or islands of nearby SNPs) where we know there’s two different local haplotypes but we don’t know which haplotypes are together on the same chromosome. Long-read sequencing can resolve much of this ambiguity.
Somewhat anomalously, this October 2010 report in Nature (“Human genome: Genomes by the thousand”) claims that thousands of genomes had already been sequenced. It mentions, for example, the 1000 Genomes Project, saying that 1KGP had already sequenced around 900 genomes. But another October 2010 report in Nature (https://pmc.ncbi.nlm.nih.gov/articles/PMC3042601/), this one from the 1KGP Consortium itself, states that they had collected WGS data for 185 people, and exon data (whole-exome, I think) for another 697 people. The exome (the parts of DNA that will end up translated into proteins) is only <2% of the human genome, so exome data is very much not equivalent to whole genome data. For this reason, I mostly ignored the report for purposes of data about WGS. (But it does have interesting info, e.g. locations worldwide of hundreds of sequencing machines.)
This 2014 news article (https://www.nature.com/articles/nbt0214-115a) reports that Illumina claimed it could sequence a genome for $1000, via a calculation “based on the use of ten systems over four years, which represents the equivalent of over 72,000 genomes”. I’m not sure how to interpret this. Assuming that a “genome equivalent” here means 1x coverage, in terms of 30x coverage this would represent around 2,000 genomes, which is not at all implausible as of 2014. (Presumably a significant portion of this sequencing was not human WGS data, but rather sequencing of partial genomes or non-human genomes.) My dataset gives a lower bound, and quite plausibly underestimates WGS datasets by a factor of 2 or more since 2010.
Another 2014 news article (https://archive.ph/egOUh) states “A record 228,000 human genomes will be completely sequenced this year by researchers around the globe, said Francis de Souza, president of Illumina.”. This seems implausible and is only a prediction, so I didn’t investigate further. Similarly, I assume that the statement by “a prominent genomicist [who] asserted a ballpark figure of ~30,000 human genomes in the year 2011” mentioned in this blog post (https://www.gnxp.com/WordPress/2011/11/07/how-many-human-genomes-have-been-sequenced/) was inaccurate, or maybe talking about something else. Plausibly they had good reason to make these predictions that turned out premature, e.g. maybe Illumina did indeed have >1 OOM decrease in its bulk WGS price; it’s also possible that I’m missing >1 OOM of WGS data.
This 2015 paper (“Big Data: Astronomical or Genomical?”) shows a graph that seems to say that, including exome data, nearly 1 million human-genome-equivalents had been sequenced. I didn’t read it carefully to check what, more precisely, they are claiming.
This October 2016 paper (“The whole genome sequences and experimentally phased haplotypes of over 100 personal genomes”) states without citation that “it is estimated that more than 200,000 individual whole human genomes have been sequenced”. This is maybe 5x my lower bound estimate, so I’m a little skeptical, but seems plausible.
The Chinese Millionome Database collected WGS data for 141k people, but did so at very low coverage—around .1x. I included this in the data, though it’s a border case. A SNP array, with around .5 million SNPs at 50bp each, might, roughly speaking, look at 25 million base pairs; WGS with .1x coverage of the 3 billion bp human genome looks at about 300 million, or an order of magnitude more genetic loci than the SNP array. On the other hand, WGS with a more common read depth of >10x has full coverage, looking at nearly all of the genome—an order of magnitude more than .1x WGS—and will be much more able to assemble longer sequences, and will be more confident about the sequence fragments, as sequencing errors can be reduced by taking the majority vote of multiple reads. (On the other hand, low-coverage sequencing is much less expensive than high-coverage. Because of the diminishing returns on information for redundant reads, for purposes of large-scale genomics projects low-coverage WGS can be more cost-effective than high-coverage, depending on other factors (such as fixed costs of collecting each sample).)
The recorded years are imprecise; they’re just the earliest report of the sequencing having been done that I found. The actual sequencing would have happened over several months or years leading up to that year.